Note
Go to the end to download the full example code
Heartbeat Evoked Arpeggios (cardiac-contingent stimuli)#
This tutorial illustrates how to use the Oximeter class to trigger stimuli
at different phases of the cardiac cycle. The PPG signal is recorded for 30 seconds
and peaks are detected online. Four notes (‘C’, ‘E’, ‘G’, ‘Bfl’) are played in synch
with peak detection with various delays: no delay, 1/4, 2/4 or 3/4 of the previous
cardiac cycle length. While R-R intervals are prone to large changes over longer
timescales, such changes are physiologically limited from one heartbeat to the next,
limiting variance in the onset synchrony between the tones and the cardiac cycle.
On this basis, each presentation time is calibrated based on the previous RR-interval.
This procedure can easily be adapted to create a standard interoception task, e.g. by
either presenting tones at no delay (systole, s+) or a fixed offset (diastole, s-).
# Author: Nicolas Legrand <nicolas.legrand@cfin.au.dk>
# Licence: GPL v3

import itertools
import time

import matplotlib.pyplot as plt
import numpy as np
import seaborn as sns
from systole import serialSim
from systole.plots import plot_circular, plot_events
from systole.recording import Oximeter
from systole.utils import norm_triggers, to_angles
Recording#
For the purpose of demonstration, here we simulate data acquisition through the pulse oximeter using pre-recorded signal.
ser = serialSim()
If you want to allow online data acquisition, you should uncomment the following lines and provide the reference of the COM port where the pulse oximeter is plugged in.
import serial
ser = serial.Serial('COM4')  # Change this value according to your setup
Create an Oximeter instance, initialize recording and record for 10 seconds
oxi = Oximeter(serial=ser, sfreq=75, add_channels=4).setup()
Reset input buffer
Play the different tones at different intervals following the detection of the systolic peaks, using the length of the previous RR interval as reference. To kee the execution of the example simple we do no pla atual sounds (e.g. using Psychopy) but this step can easily be added by adding new lines for each time window.
systoleTime1, systoleTime2, systoleTime3 = None, None, None
tstart = time.time()
while time.time() - tstart < 20:

    # Check if there are new data to read
    if oxi.serial.inWaiting() >= 5:

        # Read one incoming data point - Convert bytes into list of int
        paquet = list(oxi.serial.read(5))

        if oxi.check(paquet):  # Data consistency
            oxi.add_paquet(paquet[2])  # Add new data point

        # T + 0
        if oxi.peaks[-1] == 1:
            oxi.channels["Channel_0"][-1] = 1
            systoleTime1 = time.time()
            systoleTime2 = time.time()
            systoleTime3 = time.time()

        # T + 1/4
        if systoleTime1 is not None:
            if time.time() - systoleTime1 >= ((oxi.instant_rr[-1] / 4) / 1000):
                oxi.channels["Channel_1"][-1] = 1
                systoleTime1 = None

        # T + 2/4
        if systoleTime2 is not None:
            if time.time() - systoleTime2 >= (((oxi.instant_rr[-1] / 4) * 2) / 1000):
                oxi.channels["Channel_2"][-1] = 1
                systoleTime2 = None

        # T + 3/4
        if systoleTime3 is not None:
            if time.time() - systoleTime3 >= (((oxi.instant_rr[-1] / 4) * 3) / 1000):
                oxi.channels["Channel_3"][-1] = 1
                systoleTime3 = None
Events#
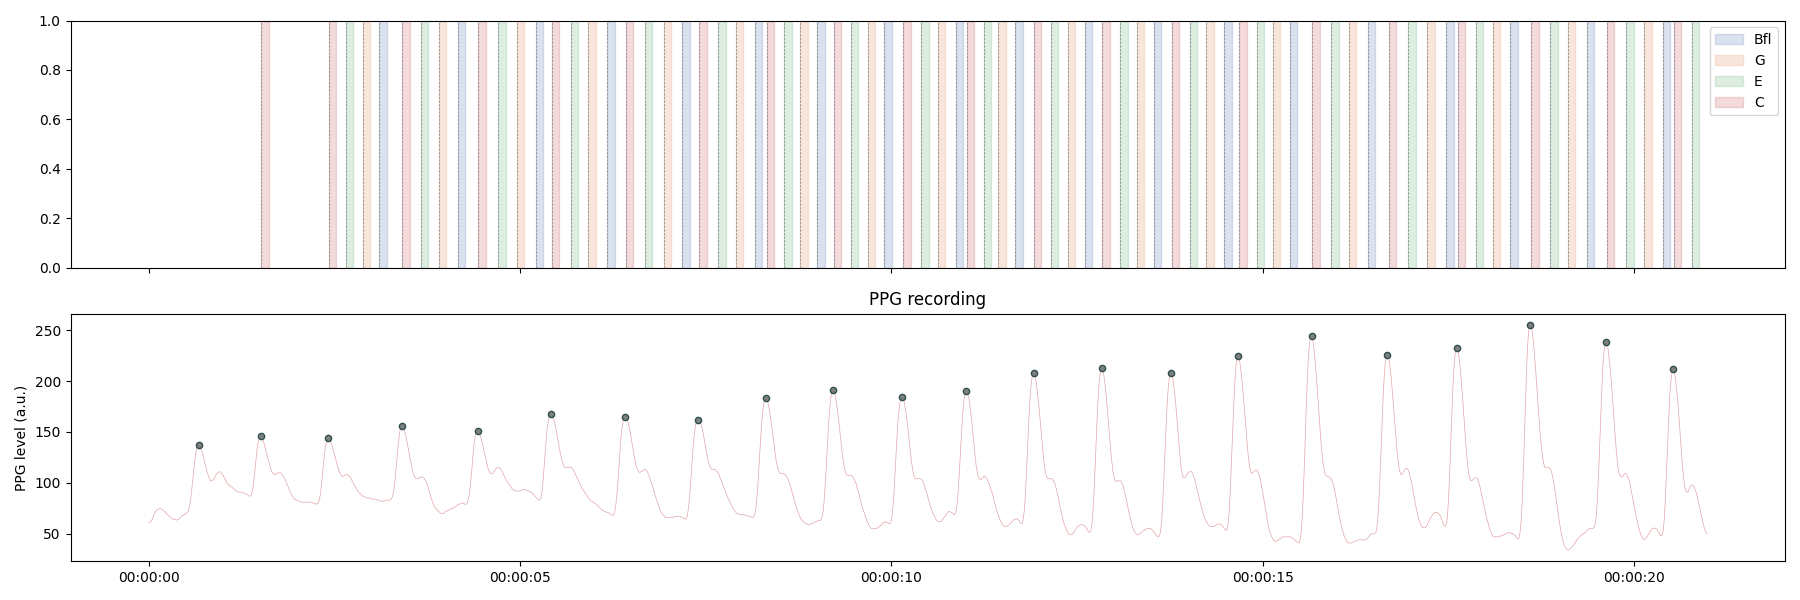
We now have triggers for the presentation of different notes relative to the systolic peaks detected in the PPG signal in real-time. We can visualize the distribution of these events using the plot_events function that will take the cleaned triggers channels as input. We can see in the plot below that the events are nicely aligned with the PPG signal.
_, axs = plt.subplots(2, 1, figsize=(18, 6), sharex=True)

# Loop across channels
events_labels = ["C", "E", "G", "Bfl"]
palette = itertools.cycle(sns.color_palette("deep"))
for i in np.arange(3, -1, -1):

    # Clan the triggers vector so we just have one trigger / event
    triggers = norm_triggers(
        triggers=oxi.channels[f"Channel_{i}"], n=10, direction="higher"
        )

    # Plot the event according to its duration (0.1 second)
    plot_events(
        triggers=triggers, tmin=0.0, tmax=0.1, sfreq=75,
        labels=events_labels[i], ax=axs[0], palette=[next(palette)])
    axs[0].set_xlabel("")

oxi.plot_raw(ax=axs[1])

plt.tight_layout()
/opt/hostedtoolcache/Python/3.9.18/x64/lib/python3.9/site-packages/systole/utils.py:41: NumbaPendingDeprecationWarning:
Encountered the use of a type that is scheduled for deprecation: type 'reflected list' found for argument 'a' of function 'np_asarray.<locals>.impl'.

For more information visit https://numba.readthedocs.io/en/stable/reference/deprecation.html#deprecation-of-reflection-for-list-and-set-types

File "../../../../../../../../../opt/hostedtoolcache/Python/3.9.18/x64/lib/python3.9/site-packages/numba/np/arraymath.py", line 4289:
        if is_nonelike(dtype):
            def impl(a, dtype=None):
            ^

  triggers = np.asarray(triggers)
/opt/hostedtoolcache/Python/3.9.18/x64/lib/python3.9/site-packages/systole/utils.py:41: NumbaPendingDeprecationWarning:
Encountered the use of a type that is scheduled for deprecation: type 'reflected list' found for argument 'object' of function 'impl_np_array.<locals>.impl'.

For more information visit https://numba.readthedocs.io/en/stable/reference/deprecation.html#deprecation-of-reflection-for-list-and-set-types

File "../../../../../../../../../opt/hostedtoolcache/Python/3.9.18/x64/lib/python3.9/site-packages/numba/np/arrayobj.py", line 5394:

    def impl(object, dtype=None):
    ^

  triggers = np.asarray(triggers)
/opt/hostedtoolcache/Python/3.9.18/x64/lib/python3.9/site-packages/numba/core/ir_utils.py:2172: NumbaPendingDeprecationWarning:
Encountered the use of a type that is scheduled for deprecation: type 'reflected list' found for argument 'triggers' of function 'norm_triggers'.

For more information visit https://numba.readthedocs.io/en/stable/reference/deprecation.html#deprecation-of-reflection-for-list-and-set-types

File "../../../../../../../../../opt/hostedtoolcache/Python/3.9.18/x64/lib/python3.9/site-packages/systole/utils.py", line 15:
@jit(nopython=True)
def norm_triggers(
^

  warnings.warn(NumbaPendingDeprecationWarning(msg, loc=loc))
Cardiac cycle#
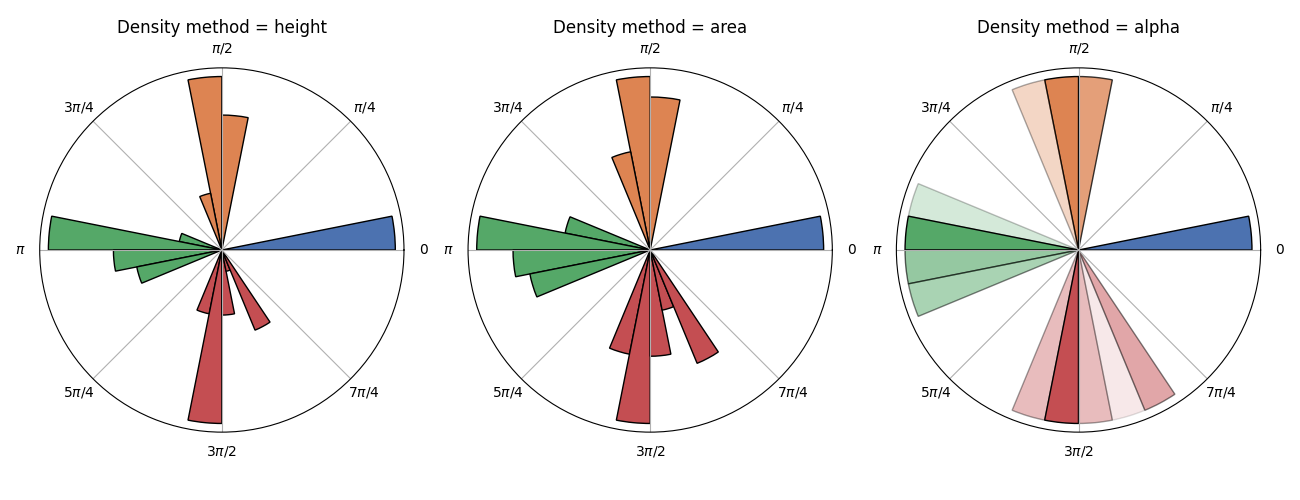
Another way to have a look at this event distribution is to look at when they occur relative to the cardiac cycle. Considering that one full cycle (beat to beat) can be represented as the full revolution around a trigonometric circle, it is possible to show the occurrence of an event relative to this cardiac phase.
# Creat a list of angular values for each conditions
angles = []
x = np.asarray(oxi.peaks)
for ev in oxi.channels:
    events = norm_triggers(
        np.asarray(oxi.channels[ev]), threshold=1, n=10, direction="higher"
    )
    angles.append(to_angles(np.where(x)[0], np.where(events)[0]))

# Plot the cardiac phase for each condition using different density representation
_, axs = plt.subplots(1, 3, figsize=(13, 5), subplot_kw=dict(projection="polar"))
for i, density in enumerate(["height", "area", "alpha"]):
    plot_circular(angles, density=density, ax=axs[i])
    axs[i].set_title(f"Density method = {density}")
/opt/hostedtoolcache/Python/3.9.18/x64/lib/python3.9/site-packages/systole/plots/backends/matplotlib/plot_circular.py:133: UserWarning: set_ticklabels() should only be used with a fixed number of ticks, i.e. after set_ticks() or using a FixedLocator.
  ax.set_xticklabels(circle_label)
/opt/hostedtoolcache/Python/3.9.18/x64/lib/python3.9/site-packages/systole/plots/backends/matplotlib/plot_circular.py:133: UserWarning: set_ticklabels() should only be used with a fixed number of ticks, i.e. after set_ticks() or using a FixedLocator.
  ax.set_xticklabels(circle_label)
/opt/hostedtoolcache/Python/3.9.18/x64/lib/python3.9/site-packages/systole/plots/backends/matplotlib/plot_circular.py:133: UserWarning: set_ticklabels() should only be used with a fixed number of ticks, i.e. after set_ticks() or using a FixedLocator.
  ax.set_xticklabels(circle_label)
/opt/hostedtoolcache/Python/3.9.18/x64/lib/python3.9/site-packages/systole/plots/backends/matplotlib/plot_circular.py:133: UserWarning: set_ticklabels() should only be used with a fixed number of ticks, i.e. after set_ticks() or using a FixedLocator.
  ax.set_xticklabels(circle_label)
/opt/hostedtoolcache/Python/3.9.18/x64/lib/python3.9/site-packages/systole/plots/backends/matplotlib/plot_circular.py:133: UserWarning: set_ticklabels() should only be used with a fixed number of ticks, i.e. after set_ticks() or using a FixedLocator.
  ax.set_xticklabels(circle_label)
/opt/hostedtoolcache/Python/3.9.18/x64/lib/python3.9/site-packages/systole/plots/backends/matplotlib/plot_circular.py:133: UserWarning: set_ticklabels() should only be used with a fixed number of ticks, i.e. after set_ticks() or using a FixedLocator.
  ax.set_xticklabels(circle_label)
/opt/hostedtoolcache/Python/3.9.18/x64/lib/python3.9/site-packages/systole/plots/backends/matplotlib/plot_circular.py:133: UserWarning: set_ticklabels() should only be used with a fixed number of ticks, i.e. after set_ticks() or using a FixedLocator.
  ax.set_xticklabels(circle_label)
/opt/hostedtoolcache/Python/3.9.18/x64/lib/python3.9/site-packages/systole/plots/backends/matplotlib/plot_circular.py:133: UserWarning: set_ticklabels() should only be used with a fixed number of ticks, i.e. after set_ticks() or using a FixedLocator.
  ax.set_xticklabels(circle_label)
/opt/hostedtoolcache/Python/3.9.18/x64/lib/python3.9/site-packages/systole/plots/backends/matplotlib/plot_circular.py:133: UserWarning: set_ticklabels() should only be used with a fixed number of ticks, i.e. after set_ticks() or using a FixedLocator.
  ax.set_xticklabels(circle_label)
/opt/hostedtoolcache/Python/3.9.18/x64/lib/python3.9/site-packages/systole/plots/backends/matplotlib/plot_circular.py:133: UserWarning: set_ticklabels() should only be used with a fixed number of ticks, i.e. after set_ticks() or using a FixedLocator.
  ax.set_xticklabels(circle_label)
/opt/hostedtoolcache/Python/3.9.18/x64/lib/python3.9/site-packages/systole/plots/backends/matplotlib/plot_circular.py:133: UserWarning: set_ticklabels() should only be used with a fixed number of ticks, i.e. after set_ticks() or using a FixedLocator.
  ax.set_xticklabels(circle_label)
/opt/hostedtoolcache/Python/3.9.18/x64/lib/python3.9/site-packages/systole/plots/backends/matplotlib/plot_circular.py:133: UserWarning: set_ticklabels() should only be used with a fixed number of ticks, i.e. after set_ticks() or using a FixedLocator.
  ax.set_xticklabels(circle_label)
Total running time of the script: (0 minutes 27.368 seconds)