Fitting single subject data using MLE#
Author: Nicolas Legrand nicolas.legrand@cfin.au.dk
Show code cell content
%%capture
import sys
if 'google.colab' in sys.modules:
    ! pip install metadpy
import matplotlib.pyplot as plt
import numpy as np
import seaborn as sns
from metadpy import load_dataset
from metadpy.mle import metad
from metadpy.plotting import plot_confidence, plot_roc

sns.set_context("talk")
In this notebook, we are going to estimate meta-d’ using Maximum Likelihood Estimation (MLE) [Fleming and Lau, 2014] using the function implemented in metadpy. This function is directly adapted from the transcription of the Matlab fit_meta_d_MLE.m by Alan Lee that can be retrieved here.
We are going to see, however, that metadpy greatly simplifies the preprocessing of raw data, letting the user fit the model for many participants/groups/conditions from the results data frame in a single command call. Another advantage here is that the python code supporting the model fitting is optimized using Numba, which greatly improves its performance.
From response-signal arrays#
# Create responses data
nR_S1 = np.array([52, 32, 35, 37, 26, 12, 4, 2])
nR_S2 = np.array([2, 5, 15, 22, 33, 38, 40, 45])
fig, axs = plt.subplots(1, 2, figsize=(13, 5))
plot_confidence(nR_S1, nR_S2, ax=axs[0])
plot_roc(nR_S1, nR_S2, ax=axs[1])
sns.despine()
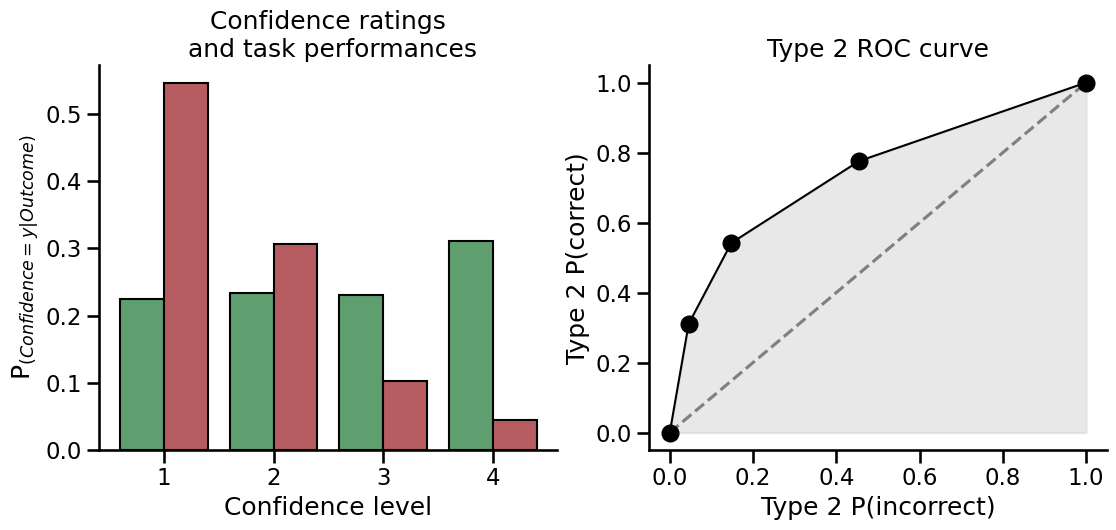
The model is fitted using the metadpy.mle.metad() function. This function accepts response-signal arrays as input if the data comes from a single subject.
output = metad(nR_S1=nR_S1, nR_S2=nR_S2)
output
| dprime | meta_d | m_ratio | m_diff | |
|---|---|---|---|---|
| 0 | 1.534994 | 1.63376 | 1.064343 | 0.098766 |
The function will return a data frame containng the dprime, metad, m_ratio and m_diff scores for this participant.
From a data frame#
To simplify the preprocessing steps, the model can also be fitted directly from the raw result data frame. The data frame should contain the following columns:
Stimuli: Which of the two stimuli was presented [0 or 1].ResponseorAccuracy: The response provided by the participant or the accuracy [0 or 1].Confidence: The confidence level [can be continuous or discrete].
In addition, it can also integrate:
Subject: The subject ID.withinorbetween: The condition or the group ID (if many groups or conditions were used).
Note that the MLE method will always fit the participant separately (i.e. in a non-hierarchical way), which means that the results will be the same by fitting each participant and condition separately (e.g. in a for loop).
df = load_dataset("rm")
df.head()
| Stimuli | Responses | Accuracy | Confidence | nTrial | Subject | Condition | |
|---|---|---|---|---|---|---|---|
| 0 | 0 | 0 | 1 | 4 | 0 | 0 | 0 |
| 1 | 1 | 1 | 1 | 4 | 1 | 0 | 0 |
| 2 | 0 | 1 | 0 | 4 | 2 | 0 | 0 |
| 3 | 1 | 0 | 0 | 1 | 3 | 0 | 0 |
| 4 | 1 | 1 | 1 | 2 | 4 | 0 | 0 |
subject_fit = metad(
    data=df[df.Subject == 0].copy(),
    nRatings=4,
    stimuli="Stimuli",
    accuracy="Accuracy",
    confidence="Confidence",
    padding=True,
)
subject_fit.head()
| dprime | meta_d | m_ratio | m_diff | |
|---|---|---|---|---|
| 0 | 0.999247 | 0.781983 | 0.782573 | -0.217264 |
Fitting at the group level#
Using a dataframe#
group_fit = metad(
    data=df,
    nRatings=4,
    stimuli="Stimuli",
    accuracy="Accuracy",
    confidence="Confidence",
    subject="Subject",
    padding=True,
    within="Condition",
)
group_fit.head()
| dprime | meta_d | m_ratio | m_diff | Subject | Condition | |
|---|---|---|---|---|---|---|
| 0 | 0.959244 | 0.739642 | 0.771068 | -0.219601 | 0 | 0 |
| 0 | 1.006310 | 0.790893 | 0.785934 | -0.215417 | 0 | 1 |
| 0 | 1.117543 | 1.084441 | 0.970379 | -0.033103 | 1 | 0 |
| 0 | 0.967871 | 0.869539 | 0.898404 | -0.098332 | 1 | 1 |
| 0 | 0.792528 | 0.670130 | 0.845560 | -0.122398 | 2 | 0 |
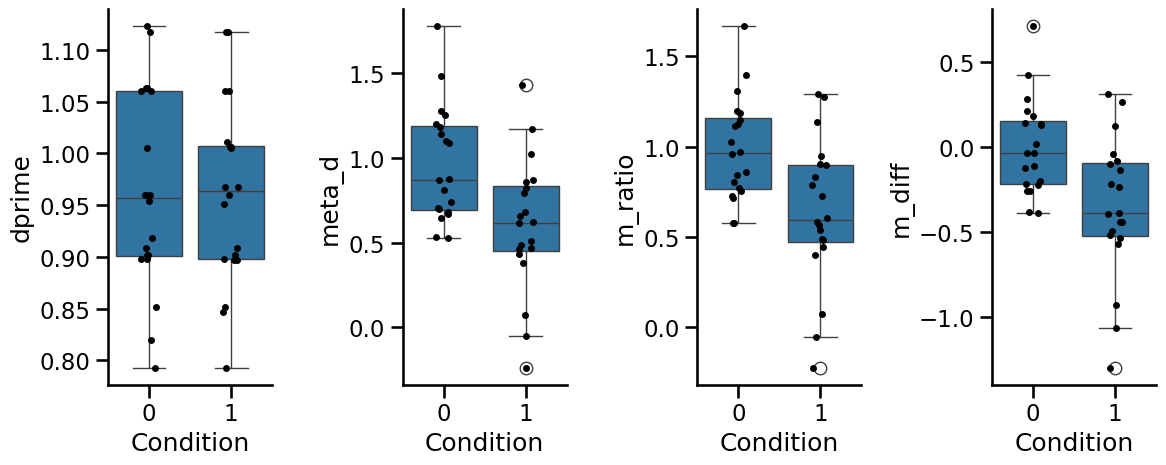
_, axs = plt.subplots(1, 4, figsize=(12, 5), sharex=True)

for i, metric in enumerate(["dprime", "meta_d", "m_ratio", "m_diff"]):

    sns.boxplot(data=group_fit, x="Condition", y=metric, ax=axs[i])
    sns.stripplot(data=group_fit, x="Condition", y=metric, color="k", ax=axs[i])

plt.tight_layout()
sns.despine()
Watermark#
%load_ext watermark
%watermark -n -u -v -iv -w -p metadpy,pytensor,pymc
Last updated: Wed Nov 08 2023

Python implementation: CPython
Python version       : 3.9.18
IPython version      : 8.17.2

metadpy : 0.1.1
pytensor: 2.17.3
pymc    : 5.9.1

sys       : 3.9.18 (main, Aug 28 2023, 08:38:32)
[GCC 11.4.0]
seaborn   : 0.13.0
matplotlib: 3.8.1
numpy     : 1.25.2

Watermark: 2.4.3