Note
Go to the end to download the full example code
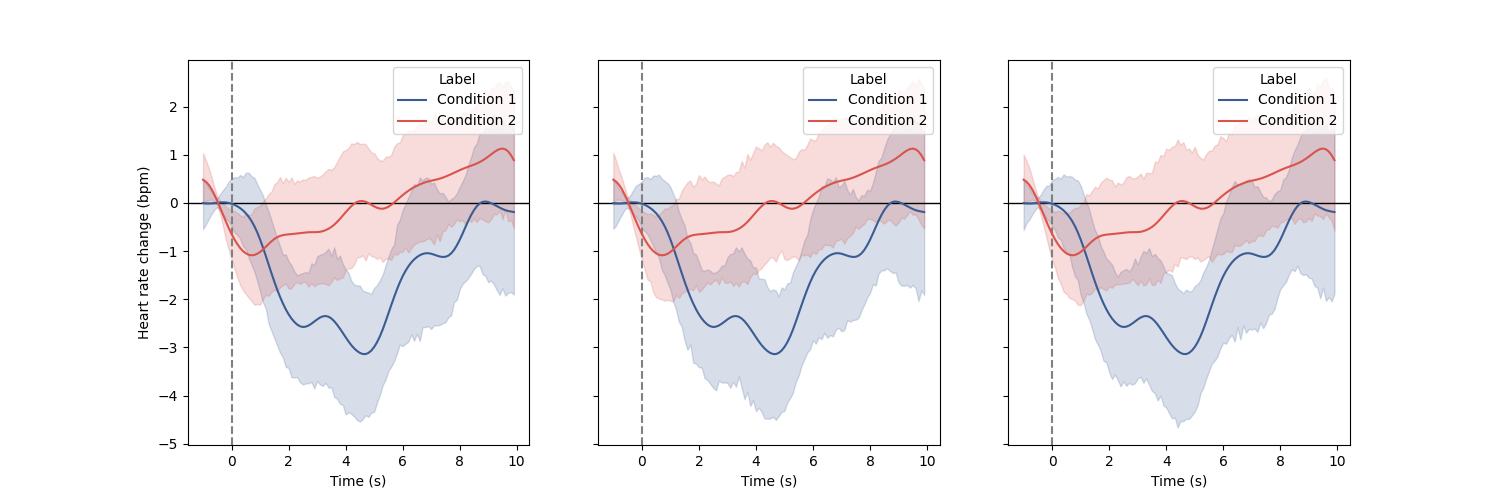
Plot evoked#
import matplotlib.pyplot as plt
import numpy as np
import seaborn as sns
from systole.detection import ecg_peaks
from systole.plots import plot_evoked
from systole.utils import heart_rate, to_epochs

from systole import import_dataset1

# Author: Nicolas Legrand <nicolas.legrand@cfin.au.dk>
# Licence: GPL v3
Plot evoked heart rate across two conditions using the Matplotlib backend Here, for the sake of example, we are going to create the same plot three time using three kind of input data: * The raw signal + the triggers timing (or a list of in case of multiple conditions). * The peaks detection + the triggers timing (or a list of in case of multiple conditions) * The epoched signal as a 2d NumPy array (or a list of in case of multiple conditions) ————————————————————–
ecg_df = import_dataset1(modalities=['ECG', "Stim"])

# Get events triggers
triggers_idx = [
     np.where(ecg_df.stim.to_numpy() == 2)[0],
     np.where(ecg_df.stim.to_numpy() == 1)[0]
]

# Peak detection in the ECG signal using the Pan-Tompkins method
signal, peaks = ecg_peaks(ecg_df.ecg, method='sleepecg', sfreq=1000)

# Convert to instantaneous heart rate
rr, _ = heart_rate(peaks, kind="cubic", unit="bpm", input_type="peaks")

# Create list epochs arrays for each condition
hr_epochs, _ = to_epochs(
    signal=rr, triggers_idx=triggers_idx, tmin=-1.0, tmax=10.0,
    apply_baseline=(-1.0, 0.0)
    )

fig, axs = plt.subplots(ncols=3, figsize=(15, 5), sharey=True)

# We define a common set of plotting arguments here
plot_args = {
     "backend": "matplotlib", "figsize": (400, 400),
     "palette": [sns.xkcd_rgb["denim blue"], sns.xkcd_rgb["pale red"]],
     "tmin": -1.0, "tmax": 10.0, "apply_baseline": (-1.0, 0.0), "decim": 100
 }

# Using the raw signal and events triggers
plot_evoked(
     signal=ecg_df.ecg.to_numpy(), triggers_idx=triggers_idx, modality="ecg",
     ax=axs[0], **plot_args
     )

# Using the detected peaks and events triggers
plot_evoked(
    rr=peaks, triggers_idx=triggers_idx, input_type="peaks", ax=axs[1],
    **plot_args
    )

# Using the list of epochs arrays
plot_evoked(
    epochs=hr_epochs, ax=axs[2], **plot_args
    )
  0%|          | 0/2 [00:00<?, ?it/s]
Downloading ECG channel:   0%|          | 0/2 [00:00<?, ?it/s]
Downloading ECG channel:  50%|█████     | 1/2 [00:00<00:00,  2.73it/s]
Downloading Stim channel:  50%|█████     | 1/2 [00:00<00:00,  2.73it/s]
Downloading Stim channel: 100%|██████████| 2/2 [00:00<00:00,  2.25it/s]
Downloading Stim channel: 100%|██████████| 2/2 [00:00<00:00,  2.31it/s]

<Axes: xlabel='Time (s)', ylabel='Heart rate change (bpm)'>
Here, for the sake of example, we are going to create the same plot three times using three kind of input data: * The raw signal + the triggers timing (or a list of in case of multiple conditions). * The peaks detection + the triggers timing (or a list of in case of multiple conditions) * The epoched signal as a 2d NumPy array (or a list of in case of multiple conditions) ————————————————————————————–
from bokeh.io import output_notebook
from bokeh.layouts import row
from bokeh.plotting import show

output_notebook()

# We define a common set of plotting arguments here
plot_args = {
     "backend": "bokeh", "figsize": (300, 300),
     "palette": [sns.xkcd_rgb["denim blue"], sns.xkcd_rgb["pale red"]],
     "tmin": -1.0, "tmax": 10.0, "apply_baseline": (-1.0, 0.0), "decim": 100
 }

# Using the raw signal and events triggers
raw_plot = plot_evoked(
     signal=ecg_df.ecg.to_numpy(), triggers_idx=triggers_idx, modality="ecg",
     **plot_args
     )

# Using the detected peaks and events triggers
peaks_plot = plot_evoked(
    rr=peaks, triggers_idx=triggers_idx, input_type="peaks", **plot_args
    )

# Using the list of epochs arrays
epochs_plots = plot_evoked(epochs=hr_epochs, **plot_args)

# Create a Bokeh layout and plot the figures side by side
show(
    row(
        raw_plot, peaks_plot, epochs_plots
        )
    )
Total running time of the script: (0 minutes 20.620 seconds)