Note
Go to the end to download the full example code
Plot instantaneous heart rate#
# Author: Nicolas Legrand <nicolas.legrand@cfin.au.dk>
# Licence: GPL v3

from bokeh.io import output_notebook
from bokeh.plotting import show
from systole.plots import plot_rr

from systole import import_rr
Plot instantaneous heart rate from a RR interval time series (in milliseconds).#
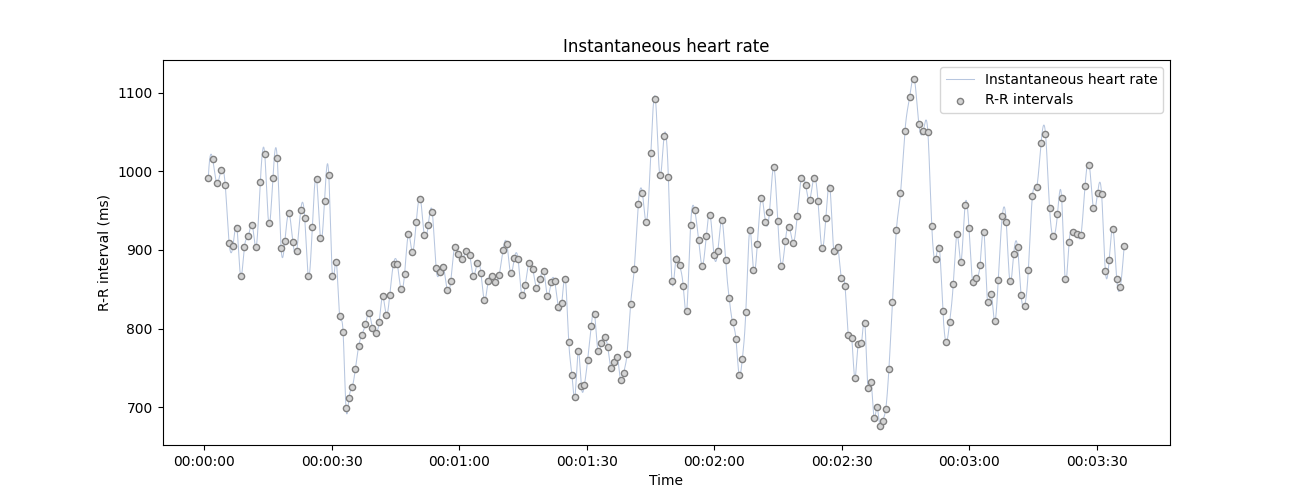
<Axes: title={'center': 'Instantaneous heart rate'}, xlabel='Time', ylabel='R-R interval (ms)'>
Only show the interpolated instantaneous heart rate, add a bad segment and change the default unit to beats per minute (BPM).#
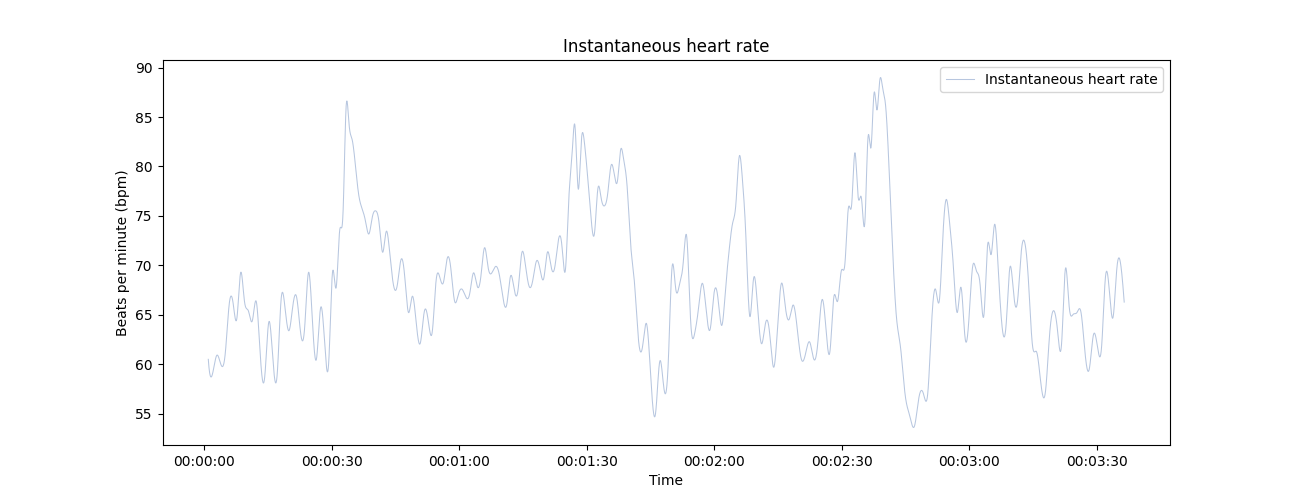
<Axes: title={'center': 'Instantaneous heart rate'}, xlabel='Time', ylabel='Beats per minute (bpm)'>
Use Bokeh as a plotting backend, only show the scatterplt and highlight artefacts in the RR intervals#
output_notebook()

show(
    plot_rr(
    rr=rr, input_type="rr_ms", backend="bokeh",
    line=False, show_artefacts=True
    )
)
BokehDeprecationWarning: CDSView.source is no longer needed, and is now ignored. In a future release, passing source will result an error.
BokehDeprecationWarning: CDSView.filters was deprecated in bokeh 3.0. Use CDSView.filter instead.
BokehDeprecationWarning: CDSView.source is no longer needed, and is now ignored. In a future release, passing source will result an error.
BokehDeprecationWarning: CDSView.filters was deprecated in bokeh 3.0. Use CDSView.filter instead.
Total running time of the script: (0 minutes 0.671 seconds)