systole.plots.plot_raw#
- systole.plots.plot_raw(signal: Union[DataFrame, ndarray, List], peaks: Optional[ndarray] = None, sfreq: int = 1000, modality: str = 'ppg', detector: str = 'default', show_heart_rate: bool = False, show_artefacts: bool = False, bad_segments: Optional[Union[ndarray, List[Tuple[int, int]]]] = None, slider: bool = True, decim: Optional[int] = 10, ax: Optional[Axes] = None, figsize: Optional[Union[int, List[int], Tuple[int, int]]] = None, backend: str = 'matplotlib', events_params: Optional[Dict] = None, **kwargs) Union[Axes, figure][source]#
Visualization of PPG or ECG signal with systolic peaks or R wave detection.
The instantaneous heart rate can be derived in a second row, as well as the events temporal distribution.
- Parameters
- signal
Dataframe of PPG or ECG signal in the long format. If a data frame is provided, it should contain at least one ‘time’ and one colum for signal (either ‘ppg’ ‘ecg’, ‘respiration’). If an array is provided, it will automatically create a DataFrame using the array as signal and sfreq as sampling frequency.
- peaks
(Optional) A boolean vetor of peaks detection (should have same length than signal). If peaks is provided, the peaks detection part is skipped and this vector is used instead.
- sfreq
Signal sampling frequency. Default is set to 1000 Hz.
- modality
The type of signal provided. Can be ‘ppg’ (pulse oximeter), ‘ecg’ (electrocardiography) or ‘resp’. This parameter will control the type of peak detection algorithm to use. Only relevant if peaks is not provided.
- detector
Peak detection algorithm to use for labelling. If modality=”ppg” (default), can be “msptd” or “rolling_average” (default). If modality=”ecg”, can be one of the following: ‘hamilton’, ‘christov’, ‘engelse-zeelenberg’, ‘pan-tompkins’, ‘wavelet-transform’, ‘moving-average’ or ‘sleepecg’ (default). If modality=”resp” the default an only algorithm available is “msptd”.
- show_heart_rate
If True, show the instnataneous heart rate below the raw signal. Defaults to False.
- show_artefacts
If True, the function will call:py:func:systole.detection.rr_artefacts to detect outliers intervalin the time serie and outline them using different colors.
- bad_segments
Mark some portion of the recording as bad. Grey areas are displayed on the top of the signal to help visualization (this is not correcting or transforming the post-processed signals). If a np.ndarray is provided, it should be a boolean of same length than signal where False indicates a bad segment. If a list is provided, it should be a list of tuples shuch as (start_idx, end_idx) for each bad segment.
- slider
If True, will add a slider to select the time window to plot (requires bokeh backend).
- decim
Factor by which to subsample the raw signal. Selects every Nth sample (where N is the value passed to decim). Default set to 10 (considering that the imput signal has a sampling frequency of 1000 Hz) to save memory.
- ax
Where to draw the plot. Default is None (create a new figure). Only applies when backend=”matplotlib”.
- figsize
Figure size. Default is (13, 5) for matplotlib backend, and the height is 300 when using bokeh backend.
- backend
Select plotting backend {“matplotlib”, “bokeh”}. Defaults to “matplotlib”.
- events_params
(Optional) Additional parameters that will be passed to
systole.plots.plot_events()and plot the events timing in the backgound.- **kwargs
Additional arguments will be passed to :py:func:systole.detection.ppg_peaks() or :py:func:systole.detection.ecg_peaks(), depending on the type of data.
- Returns
- plot
The matplotlib axes, or the bokeh figure containing the plot.
See also
Examples
Plotting raw ECG recording with automatic R peaks labelling.
from systole import import_dataset1
from systole.plots import plot_raw

# Import PPG recording as pandas data frame
ecg = import_dataset1(modalities=['ECG'])

# Only use the first 60 seconds for demonstration
ecg = ecg[ecg.time.between(60, 90)]
plot_raw(ecg, modality='ecg', sfreq=1000, detector='sleepecg')
<Axes: title={'center': 'ECG recording'}, ylabel='ECG (mV)'>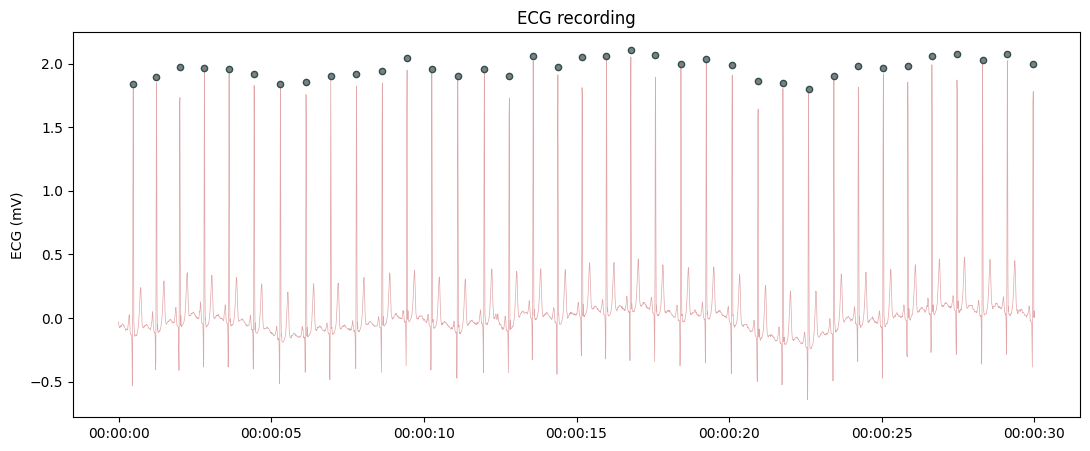
Plotting raw respiration recording with automatic labelling of inspiratory peaks.
from systole import import_dataset1
from systole.plots import plot_raw

# Import Respiration recording as pandas data frame
rsp = import_dataset1(modalities=['Respiration'])

# Only use the first 90 seconds for demonstration
rsp = rsp[rsp.time.between(500, 600)]
plot_raw(rsp, sfreq=1000, modality="respiration")
<Axes: title={'center': 'Respiration'}, ylabel='Respiratory signal'>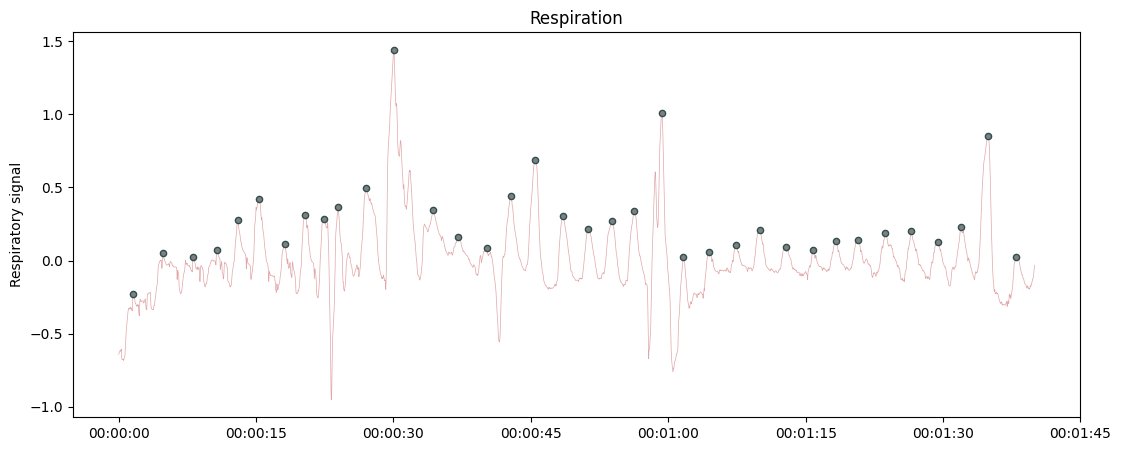
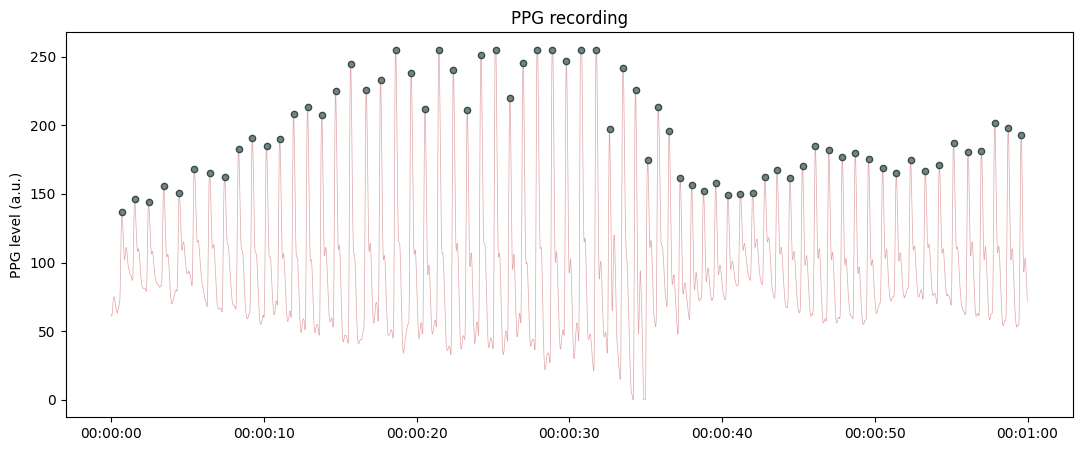
Plotting raw PPG recording with automatic labelling of the systolic peaks.
from systole import import_ppg

# Import PPG recording as pandas data frame
ppg = import_ppg()

# Only use the first 60 seconds for demonstration
plot_raw(ppg[ppg.time<60], sfreq=75);
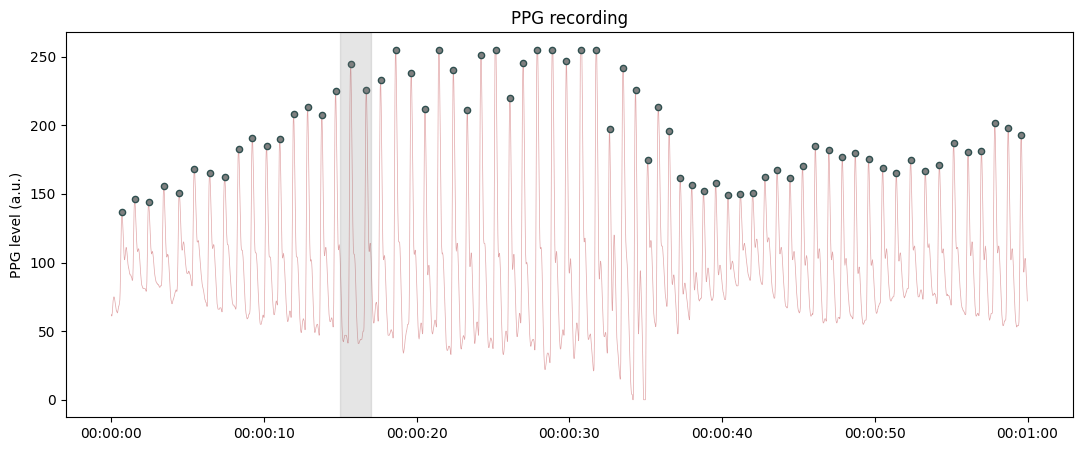
Highlighting a bad segment in the recording.
from systole import import_ppg
from systole.plots import plot_raw

# Only use the first 60 seconds for demonstration
# The bad segments are annotated using a tuple (start, end) in miliseconds
plot_raw(ppg[ppg.time<60], sfreq=75, bad_segments=[(15000, 17000)]);
Using Bokeh as plotting backend, with automatic systolic peaks labelling and show the instantaneous heart rate in a second panel with automated labelling of RR interval artefacts.