systole.plots.plot_events#
- systole.plots.plot_events(triggers: Optional[Union[List, ndarray]] = None, triggers_idx: Optional[Union[List, ndarray]] = None, labels: Optional[Union[Dict[str, str], List, str]] = None, tmin: float = -1.0, tmax: float = 10.0, sfreq: int = 1000, behavior: Optional[Union[List, DataFrame]] = None, figsize: Optional[Union[int, List[int], Tuple[int, int]]] = None, ax: Optional[Axes] = None, backend: str = 'matplotlib', palette: Optional[List[str]] = None) Union[Axes, figure][source]#
Visualize the occurence of events along the physiological recording.
- Parameters
- triggers
The events triggers. 0 indicates no events, 1 indicates the triger for one event. Different conditions should be provided separately as list of arrays.
- triggers_idx
Trigger indexes. Each value encode the sample where an event occured (see also sfreq). Different conditions should be provided separately as list of arrays (can have different lenght).
- labels
The events label. The key of the dictionary is the condition number (from 1 to n, as str), the value is the label (str). Default set to {“1”: “Event - 1”} if one condition is provided, and generalize up to n conditions {“n”: “Event - n”}.
- tmin, tmax
Start and end time of the epochs in seconds, relative to the time-locked event. Defaults to -1.0 and 10.0, respectively.
- sfreq
Signal sampling frequency. Default is set to 1000 Hz.
- behavior
(Optional) Additional information about trials that will appear when hovering on the area (bokeh version only). A py:class:pd.DataFrame instance with length = n trials, or a list of py:class:pd.DataFrame (for multiple conditions) should be provided.
- figsize
Figure size. Default is (13, 5).
- ax
matplotlib.axes.Axes|bokeh.plotting.figure.Figure| None Where to draw the plot. Default is None (create a new figure).
- backend
Select plotting backend (“matplotlib”, “bokeh”). Defaults to “matplotlib”.
- palette
Color palette. Default sets to Seaborn “deep”.
- Returns
- plot
The matplotlib axes, or the boken figure containing the plot.
- Raises
- ValueError
When no triggers or triggers indexes are provided. When both triggers and triggers indexes are provided. If the length of behavior optional data does not match with the provide triggers. If invalid event names are provided.
Examples
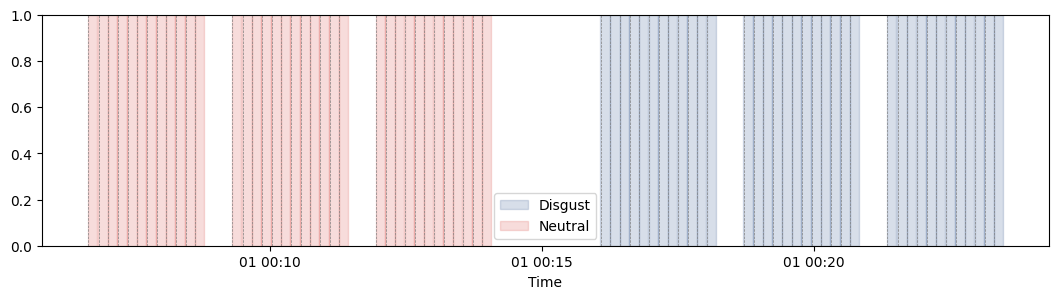
Plot events distributions using Matplotlib as plotting backend.
import numpy as np
import seaborn as sns
from systole.plots import plot_events
from systole import import_dataset1

ecg_df = import_dataset1(modalities=['ECG', "Stim"])

# Get events triggers
triggers_idx = [
     np.where(ecg_df.stim.to_numpy() == 2)[0],
     np.where(ecg_df.stim.to_numpy() == 1)[0]
]

plot_events(
    triggers_idx=triggers_idx, labels=["Disgust", "Neutral"],
    tmin=-0.5, tmax=10.0, figsize=(13, 3),
    palette=[sns.xkcd_rgb["denim blue"], sns.xkcd_rgb["pale red"]],
 )
<Axes: xlabel='Time'>
Plot events distributions using Bokeh as plotting backend and add the RR time series.
from systole.detection import ecg_peaks
from systole.plots import plot_rr
from bokeh.io import output_notebook
from bokeh.plotting import show
output_notebook()

# Peak detection in the ECG signal using the Pan-Tompkins method
signal, peaks = ecg_peaks(ecg_df.ecg, method='pan-tompkins', sfreq=1000)

# First, we create a RR interval plot
rr_plot = plot_rr(peaks, input_type='peaks', backend='bokeh', figsize=250)

# Then we add events annotations to this plot using the plot_events function
show(
     plot_events(
         triggers_idx=triggers_idx, labels=["Disgust", "Neutral"],
         tmin=-0.5, tmax=10.0, ax=rr_plot.children[0], backend="bokeh",
         palette=[sns.xkcd_rgb["denim blue"], sns.xkcd_rgb["pale red"]],
     )
)