systole.plots.plot_evoked#
- systole.plots.plot_evoked(epochs: Optional[List[ndarray]] = None, signal: Optional[Union[List, ndarray]] = None, triggers: Optional[ndarray] = None, triggers_idx: Optional[ndarray] = None, rr: Optional[Union[List, ndarray]] = None, input_type: str = 'peaks', reject: Optional[ndarray] = None, modality: str = 'ppg', tmin: float = -1.0, tmax: float = 10.0, sfreq: int = 1000, apply_baseline: Optional[Union[float, Tuple[float, float]]] = 0.0, decim: Optional[int] = None, labels: Optional[Union[str, List[str]]] = None, unit: str = 'bpm', kind: str = 'cubic', ax: Optional[Axes] = None, figsize: Optional[Tuple[float, float]] = None, backend: str = 'matplotlib', **kwargs) Union[figure, Axes][source]#
Plot evoked heart rate across trials.
- Parameters
- epochs
A list of 2d (trial * time) numpy array containing the time series of the epoched signal. When multiple arrays are provided, will be plotted separately as different conditions.
- signal
A 1d numpy array containing the physiological signal (can be PPG or ECG). The modality of the signal is parametrized using the modality parameter.
- triggers
The boolean indices of the events, shape=(times*sfreq, 1).
- triggers_idx
Trigger indexes. Each value encode the sample where an event occured (see also sfreq). Different conditions should be provided separately as list of arrays (can have different lenght).
- rr
Boolean vector of peaks detection or peaks indexs. See input_type.
- input_type
The type of input vector. Can be “peaks”, “peaks_idx”, “rr_ms”, or “rr_s”. Default to “peaks”.
- rejectnp.ndarray | None
Segments of the signal that should be rejected.
- modality
The recording modality (can be “ppg” or “ecg”). Only required when using signal. The modality will determine the peaks detection method.
- tmin, tmax
Start and end time of the epochs in seconds, relative to the time-locked event. Defaults to -1.0 and 10.0, respectively.
- sfreq
The sampling frequency of the input signal and triggers. Default set to 1000.
- apply_baseline
If int or tuple, use the point or interval to apply a baseline (method: mean). If None, no baseline is applied. Default is set to 0.
- decim
Factor by which to subsample the data. Selects every Nth sample (where N is the value passed to decim). Default set to None (no decim).
- labels
The condition labels.
- unit
The heart rate unit. Can be ‘rr’ (R-R intervals, in ms) or ‘bpm’ (beats per minutes). Default is ‘bpm’.
- kind
This argument will be passed too:py:func:systole.utils.heart_rate and control the type of interpolation between instantaneous heart rate estimates. This is then the method used by scipy.interpolate.interp1d). Can be ‘cubic’ (defalut), ‘linear’, ‘previous’ or ‘next’.
- ax
Where to draw the plot. Default is None (create a new figure).
- figsize
Figure size. Default is set to (13, 5) if backend==”matplotlib” and (400, 400) if backend==”bokeh”.
- backend
Select plotting backend (“matplotlib”, “bokeh”). Default sets to “matplotlib”.
- kwargs:
Other keyword arguments are passed down to py:func:seaborn.lineplot() if backend is “matplotlib”.
- Returns
- plot
The matplotlib axes, or the boken figure containing the plot.
See also
Examples
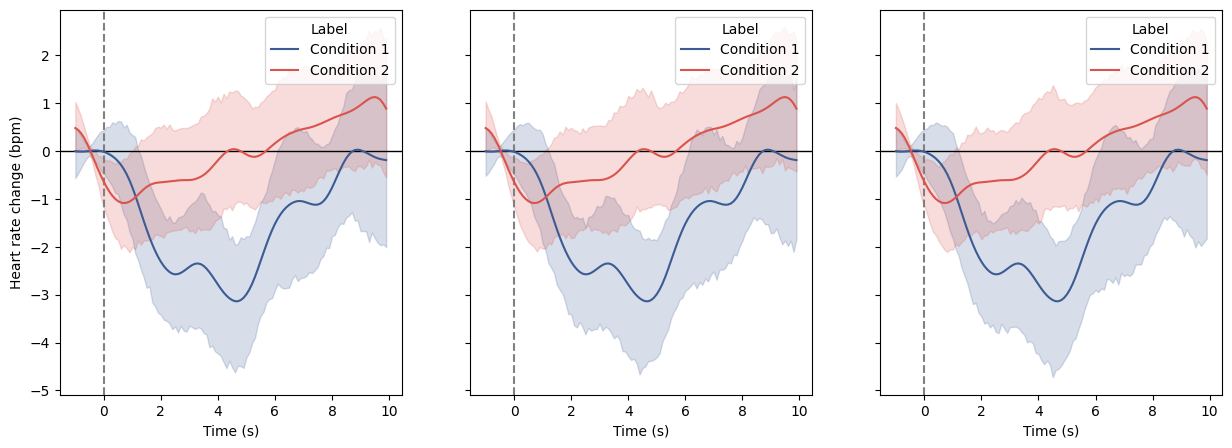
Plot evoked heart rate across two conditions using the Matplotlib backend. Here, for the sake of example, we are going to create the same plot three time using three kind of input data:
The raw signal + the triggers timing (or a list of in case of multiple conditions).
The peaks detection + the triggers timing (or a list of in case of multiple conditions)
The epoched signal as a 2d NumPy array (or a list of in case of multiple conditions)
import numpy as np
import seaborn as sns
import matplotlib.pyplot as plt
from systole.detection import ecg_peaks
from systole.plots import plot_evoked
from systole import import_dataset1
from systole.utils import heart_rate, to_epochs

ecg_df = import_dataset1(modalities=['ECG', "Stim"])

# Get events triggers
triggers_idx = [
     np.where(ecg_df.stim.to_numpy() == 2)[0],
     np.where(ecg_df.stim.to_numpy() == 1)[0]
]

# Peak detection in the ECG signal using the Pan-Tompkins method
signal, peaks = ecg_peaks(ecg_df.ecg, method='sleepecg', sfreq=1000)

# Convert to instantaneous heart rate
rr, _ = heart_rate(peaks, kind="cubic", unit="bpm", input_type="peaks")

# Create list epochs arrays for each condition
hr_epochs, _ = to_epochs(
    signal=rr, triggers_idx=triggers_idx, tmin=-1.0, tmax=10.0,
    apply_baseline=(-1.0, 0.0)
    )

fig, axs = plt.subplots(ncols=3, figsize=(15, 5), sharey=True)

# We define a common set of plotting arguments here
plot_args = {
     "backend": "matplotlib", "figsize": (400, 400),
     "palette": [sns.xkcd_rgb["denim blue"], sns.xkcd_rgb["pale red"]],
     "tmin": -1.0, "tmax": 10.0, "apply_baseline": (-1.0, 0.0), "decim": 100
 }

# Using the raw signal and events triggers
plot_evoked(
     signal=ecg_df.ecg.to_numpy(), triggers_idx=triggers_idx, modality="ecg",
     ax=axs[0], **plot_args
     )

# Using the detected peaks and events triggers
plot_evoked(
    rr=peaks, triggers_idx=triggers_idx, input_type="peaks", ax=axs[1],
    **plot_args
    )

# Using the list of epochs arrays
plot_evoked(
    epochs=hr_epochs, ax=axs[2], **plot_args
    )
<Axes: xlabel='Time (s)', ylabel='Heart rate change (bpm)'>
Plot evoked heart rate across two conditions using the Bokeh backend. Here, for the sake of example, we are going to create the same plot three times using three kind of input data:
The raw signal + the triggers timing (or a list of in case of multiple conditions).
The peaks detection + the triggers timing (or a list of in case of multiple conditions)
The epoched signal as a 2d NumPy array (or a list of in case of multiple conditions)
from bokeh.io import output_notebook
from bokeh.plotting import show
from bokeh.layouts import row
output_notebook()

# We define a common set of plotting arguments here
plot_args = {
     "backend": "bokeh", "figsize": (400, 400),
     "palette": [sns.xkcd_rgb["denim blue"], sns.xkcd_rgb["pale red"]],
     "tmin": -1.0, "tmax": 10.0, "apply_baseline": (-1.0, 0.0), "decim": 100
 }

# Using the raw signal and events triggers
raw_plot = plot_evoked(
     signal=ecg_df.ecg.to_numpy(), triggers_idx=triggers_idx, modality="ecg",
     **plot_args
     )

# Using the detected peaks and events triggers
peaks_plot = plot_evoked(
    rr=peaks, triggers_idx=triggers_idx, input_type="peaks", **plot_args
    )

# Using the list of epochs arrays
epochs_plots = plot_evoked(epochs=hr_epochs, **plot_args)

# Create a Bokeh layout and plot the figures side by side
show(row(raw_plot, peaks_plot, epochs_plots))